Your RA's buy call landed at 420. The stock opened at 441.
The target in that PDF was computed at a price that no longer exists. You're doing mental math — does the MoS still hold? Am I already over-allocated? StockTracker recomputes buy price, margin of safety and IRR against the live price the moment you open it. When markets fall and noise spikes, you open one screen: which names are below your buy price, which are under-allocated, the exact rupees to deploy. The data decides — not the panic.
Using an RA service? See how StockTracker was built for you →- Target buy
- ₹3,400
- Margin of safety
- -5.9%
- Base-case IRR (3y)
- 5.3%
Numbers frozen the day it was printed. Is it still a buy today? You can't tell.
See it work — not just read about it
Three of the moments StockTracker was built for. Everything below is the real product surface.
Your assumptions. A buy price range that moves with the market.
Enter your bull, base and bear case — target multiple, growth, margin. StockTracker back-solves the buy price for each scenario, giving you a range instead of a single number. As the price moves, margin of safety, IRR and the BUY signal update in real time. Never stale, never a guess.
- Target buy
- ₹3,400
- Margin of safety
- -5.9%
- Base-case IRR (3y)
- 5.3%
Numbers frozen the day it was printed. Is it still a buy today? You can't tell.
Allocation anchored to your conviction
Star ratings become target weight bands. Every under- and over-weight position is flagged with the exact rupees to add or trim — so incremental capital follows conviction, not emotion.
A living timeline for every company
Log each quarter's result, guidance and concall notes with images, PDFs and links. Years of tracking, scrollable in minutes when it's time to add or trim.
- Q1 FY2612 Jul 2025
Revenue +18% YoY, margins held despite input costs. Mgmt guided 20%+ for FY26.
📊 chart📄 concall PDF - Annual Report05 Jun 2025
Capex cycle nearing completion — FCF inflection expected FY27. Promoter pledge nil.
📄 AR FY25🔗 filing - Q4 FY2528 Apr 2025
Beat estimates on volume. New segment scaling faster than modelled.
🔗 interview
Built for how serious investors actually work
However you run your portfolio, StockTracker fits the workflow you already have — and removes the busywork.
The report subscriber
Tired of static PDF targets that don't move when the price does.
The capital deployer
Fresh cash to invest and no objective way to decide where it goes.
The concentrated investor
20–40 high-conviction names, sized by conviction, held for years.
The watchlist hunter
A pipeline of great businesses you'll buy — only at the right price.
The quarterly tracker
Every concall, every guidance revision, logged and never lost.
The multi-account household
Self, spouse and HUF demats — one true, consolidated position.
Everything a value investor needs, in one place
Research, valuation, holdings and allocation — without juggling spreadsheets, notes and PDFs.
One-click Zerodha import
Upload a holdings statement and every position — quantity, average cost, ISIN — lands instantly, auto-creating companies and detecting the account.
Multi-account consolidation
Track any number of demat accounts and see a single true position, cost-weighted, or drill into one account at a time.
Bull / base / bare valuation
Enter one lever — target PE or EV/EBITDA — and the model back-solves target market cap, IRR and the buy price that earns your required return.
Multi-year projection models
A spreadsheet-grade grid computes PAT, margins, growth and forward PEG across years — without the fragile formulas.
Conviction-driven allocation
Star ratings set target weight bands you control. The allocation view flags every over- and under-weight position, to the rupee.
Thesis, timeline & highlights
Write your thesis, log quarterly notes with images, PDFs and links, and pin the points that would make you buy more — or sell.
Watchlist that's buy-ready
Research names before you own them with the same depth, so when the price comes to you the homework is already done.
Private by default
Every account's data is isolated per user with row-level security. Your portfolio is only ever visible to you.
Designed for the way you actually check your portfolio
Native bottom nav, swipe-friendly cards, instant BUY zone scanning — the full product in your pocket, not a stripped-down mobile view.
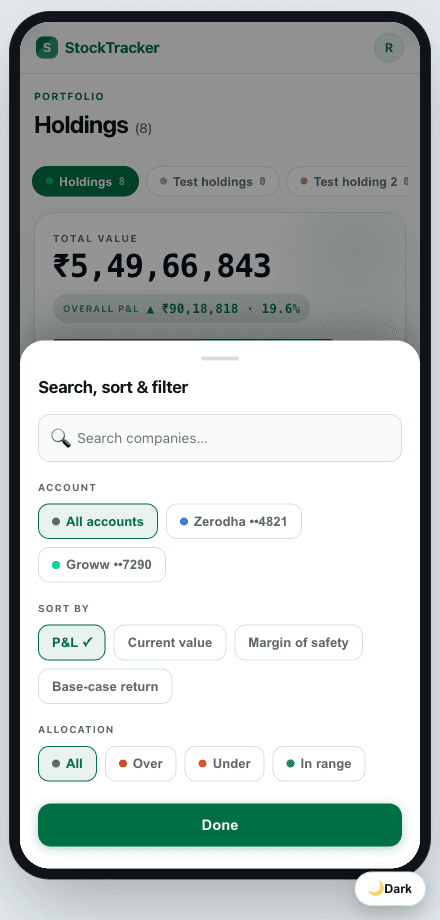
Sort & filter on the go
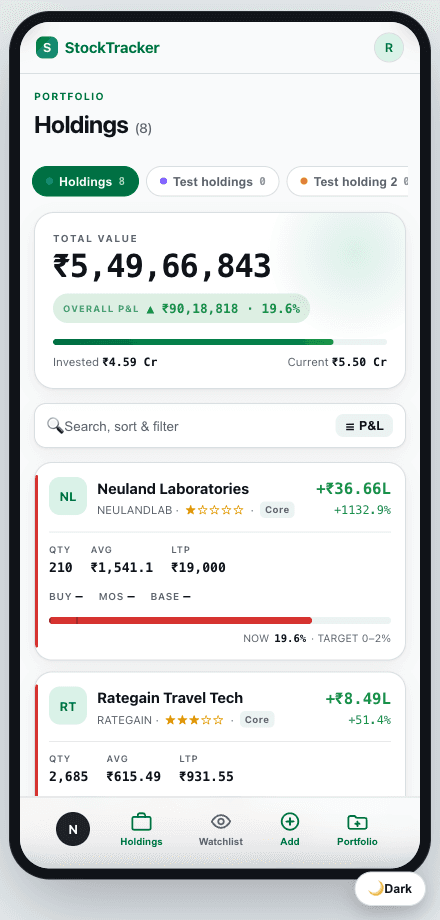
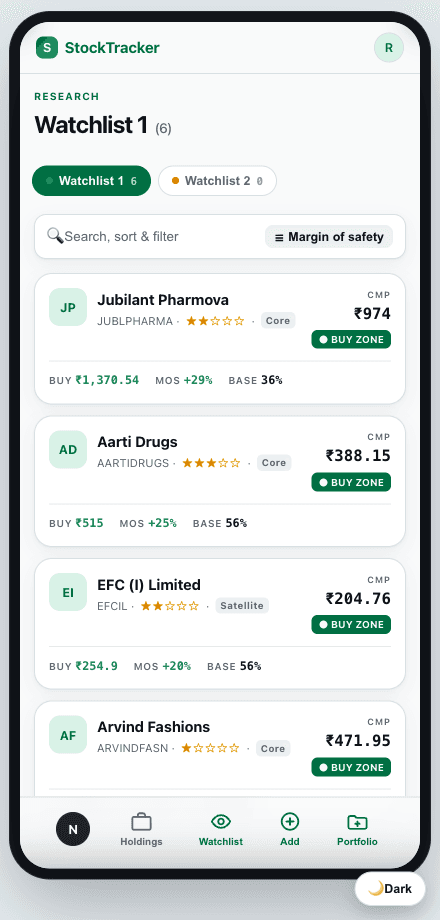
BUY zones, instantly
A modern replacement for your stock-tracking spreadsheet
StockTracker grew out of a real Excel investing model. It keeps the rigor — multi-year models, valuation scenarios, margin of safety — but removes the broken formulas, version chaos and manual data entry. Sign in and bring your whole process online.
Frequently asked questions
- Do the valuations update when the price changes?
- Yes — that's the whole point. Unlike a static research PDF, StockTracker recomputes margin of safety, IRR, target buy price and the BUY signal against the live price every time you look. The numbers are never stale.
- Can it import my Zerodha holdings?
- In one click. Upload your Zerodha holdings statement and every position is parsed instantly — quantity, average cost and ISIN — and companies are created for you. You can also add holdings manually for any broker.
- Can it track multiple demat accounts?
- Yes. Import a statement for each account (self, spouse, HUF, and more) and StockTracker consolidates them into one true position, cost-weighted — while still letting you filter to any single account.
- How does the allocation feature help me invest incrementally?
- You assign each holding a star rating, and each rating maps to a target weight band you configure. The allocation view then shows which positions are under- or over-weight and the exact rupee amount to add or trim to get back in range.
- Does it calculate intrinsic value and margin of safety?
- Yes. Build a multi-year model, set bull/base/bare assumptions, and StockTracker computes target market cap, IRR, forward PEG, the disciplined buy price and margin of safety automatically.
- Is StockTracker free, and is my data private?
- It's currently free — sign in with Google and start in seconds. Your data is isolated per user with row-level security, so your portfolio is only ever visible to you. And you stay in full control: delete a portfolio and everything inside it — imported holdings, companies and all your research and thesis notes — is permanently and irreversibly removed. There's no soft-delete and no hidden archive left behind.
Your financial data stays yours
Your data, only yours
Row-level security is enforced at the database: your portfolio is never visible to any other user or query — even if two accounts hold the same stock.
Encrypted in transit and at rest
All traffic runs over HTTPS. Your data is encrypted at rest on the hosting infrastructure.
Delete everything, permanently
Settings → Delete Account removes your portfolio, holdings, research notes, uploaded files and your account instantly. No recovery, no grace period, no archive.